Introduction
In today’s fast-paced work environments, productivity is often judged by surface-level metrics like tasks completed or hours logged. While useful, these numbers don’t tell the whole story. They overlook important human factors like job satisfaction, training, and whether employees feel engaged in their work.
This article explores how data analytics and machine learning can offer a deeper look into what really drives productivity — and why some employees choose to leave. We go beyond basic performance stats by creating a Comprehensive Productivity Index (CPI), predicting who might resign, and grouping employees into behavioral segments using clustering. Finally, we use SHAP, a tool that helps explain AI decisions, to understand why the model makes certain predictions.
Whether you’re in HR, leadership, or analytics, this guide shows how modern data tools can help spot problems early, support your team better, and improve retention.
Data & Methodology
We used an open-source dataset from Kaggle that includes anonymized information on employees’ performance, satisfaction, and resignation status. The dataset includes:
- Hours worked
- Projects handled
- Satisfaction scores
- Monthly salary
- Training hours
- Years at the company

Step 1: Creating a Comprehensive Productivity Index (CPI)
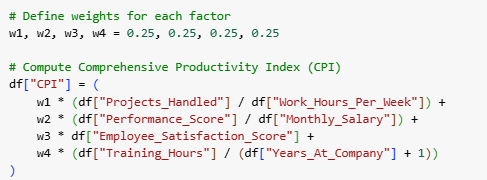
To understand productivity more holistically, we created a Comprehensive Productivity Index (CPI). Instead of relying on one measure, the CPI blends multiple aspects of performance:
- Projects per hour worked (output efficiency)
- Performance score per salary (value for investment)
- Satisfaction score (engagement)
- Training hours per year at the company (growth mindset)
Each factor was weighted equally, and the combined score (CPI) allowed us to fairly compare employees across roles and tenure.
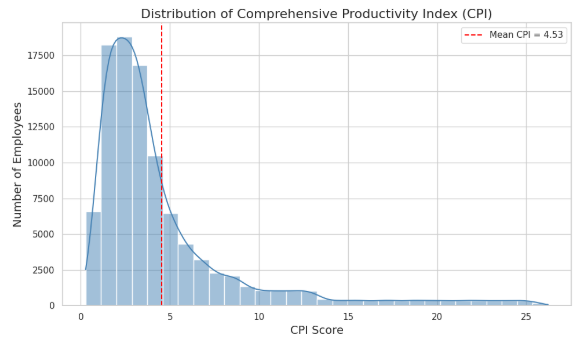
A histogram of CPI scores revealed a typical “long tail”: most employees had moderate productivity, with a few high-performing outliers.
Step 2: Predicting Employee Turnover
Next, we used machine learning models to predict who might resign. We tested the following models:
- Decision Tree
- Random Forest
- Gradient Boosting
We trained each model using 80% of the data and tested on the remaining 20%. The Gradient Boosting model had the best performance.
Step 3: Segmenting Employees Using Clustering
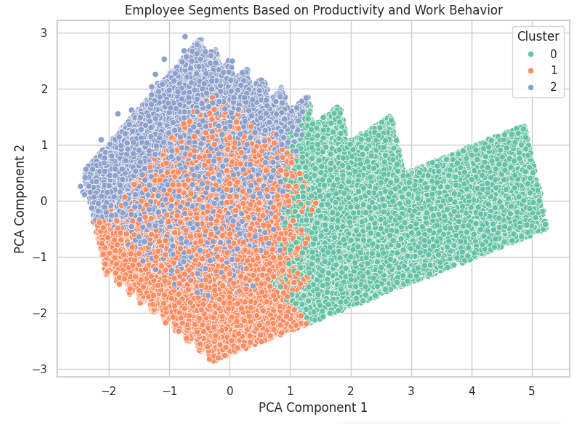
To gain deeper insight into the workforce, we applied K-Means clustering — a technique that groups To uTo better understand workforce behaviors, we applied K-Means clustering. We grouped employees based on:
- CPI
- Satisfaction score
- Training hours
- Years at company
The clustering revealed three key employee segments with overlapping but distinct patterns.
Step 4: Explaining Predictions with SHAP
Machine learning can often feel like a “black box.” To interpret our model’s predictions, we used SHAP (SHapley Additive Explanations). SHAP shows how much each feature contributes to an individual prediction.
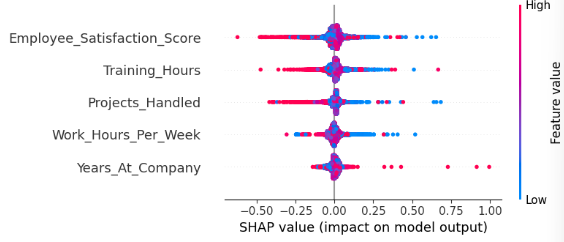
Sample SHAP summary plot showed:
CPI had some influence, but less than emotional engagement.
Satisfaction had the largest impact — lower scores significantly increased resignation risk.
Training hours showed a mixed effect — lots of training without support could signal burnout.
Understanding the CPI: A Smarter Way to Measure Productivity
Productivity is more than just hours or task counts. The Comprehensive Productivity Index (CPI) lets us look at multiple aspects of performance:
| Factor | What It Tells Us |
|---|---|
| Projects per hour | Output efficiency |
| Performance per salary | Value for investment |
| Satisfaction score | Emotional engagement |
| Training per year | Growth and development effort |
This blended score gives companies a more meaningful way to identify high performers and spot areas for improvement.
Predicting Resignations with Machine Learning
Top predictors of resignation:
- Employee satisfaction
- Training hours
- Years at the company
CPI alone wasn’t a strong predictor, emphasizing that engagement and support matter more than productivity alone.
Key Insight: Even high performers are at risk of leaving if they’re not satisfied or well-supported.
Segmenting the Workforce: The 3 Employee Types We Found
With clustering, we identified three overlapping but informative employee segments. While the boundaries between groups weren’t sharply separated, the analysis still revealed meaningful patterns in productivity, satisfaction, and training behaviors.
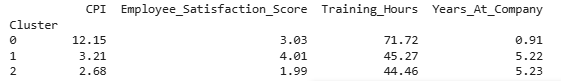
Cluster 0: High-Output Newcomers
- Very high CPI (12.15)
- Moderate satisfaction (3.03)
- High training hours (~72)
- New to the company (less than 1 year)
These are highly trained, very productive newcomers. But their satisfaction isn’t yet high — possibly because they’re still adjusting or under pressure.
Action: Focus on onboarding support and early engagement to prevent burnout.
Cluster 1: Stable Contributors
- Moderate CPI (3.21)
- High satisfaction (4.01)
- Consistent training (~45 hours)
- Long tenure (5+ years)
These are reliable, satisfied employees with experience and balanced productivity.
Action: Keep them engaged with growth opportunities and recognition — they’re your core workforce.
Cluster 2: Disengaged Veterans
- Lowest CPI (2.68)
- Very low satisfaction (1.99)
- Similar training and tenure as Cluster 1
Despite being with the company a long time, these employees are unhappy and underperforming.
Action: Consider coaching, role shifts, or deeper engagement strategies to reconnect them.
Key Takeaway: Tenure and training don’t guarantee performance or satisfaction. How employees feel about their work is just as important as how long they’ve been doing it.
Making Predictions Explainable with SHAP
To go deeper into why someone might leave, we used SHAP values. These show how much each factor (like satisfaction or training) influenced the model’s prediction.
SHAP Insights:
SHAP helped us understand why certain employees were predicted to resign:
- Low satisfaction → higher resignation risk
- Excessive training without support → possible burnout
- CPI and tenure had weaker influence
Final Recommendations
Based on everything we learned, here’s how organizations can use data to improve productivity and retention:
Focus on Employee Satisfaction
- High satisfaction keeps people around — even more than productivity.
- Use regular surveys and open communication to catch dissatisfaction early.
Train with Purpose
- Training is valuable, but it needs to align with career goals.
- Avoid overwhelming employees with training if they’re not supported emotionally or professionally.
Customize You HR Strategy
- Use employee segments to tailor support.
- Newcomers need onboarding.
- Veterans may need fresh challenges.
- Stable contributors may be ready for leadership or stretch roles.
Use Predictive Tools Proactively
- Predictive models and SHAP help you spot flight risks early.
- Use data not just to understand who left — but who might leave next.
Key Takeaways
- Surface metrics don’t capture real productivity — CPI does.
- High performers can still leave if they’re disengaged.
- Employee clusters reveal meaningful patterns for tailored HR action.
- SHAP makes AI decisions transparent and actionable.
Conclusion
This project underscores the power of data-driven insight in understanding productivity, engagement, and retention. But turning these insights into action takes more than tools — it takes strategy.
At Productivity Advocates, we help organizations look past surface-level KPIs and uncover the human stories behind the data. Through advanced analytics like clustering, predictive modeling, and SHAP, we empower leaders to:
- Identify at-risk employees before it’s too late
- Tailor engagement strategies to different employee types
- Improve training, morale, and retention
Don’t let guesswork drive your workforce strategy. Use data science with a human lens to build a stronger, more sustainable team.
Partner with Productivity Advocates. Let your data tell the story — and make decisions that matter.
Image Credits
All images, charts, and graphics in this article were created by Stephanie M. Liechty using Google Colab and Canva